
This is Part 2 of a three-part series. Read Part 1 and Part 3.
25 January 2016
So, we finished last time by agreeing (well actually by me proposing and not receiving any objections) that we need to consider frequency of operation when it comes to Whole of Organisation operational risk assessment. We also agreed (this was unanimous), that I'm incapable of making a three-dimensional matrix jump out of your screen, so let's push on with the discussion of an example instead.
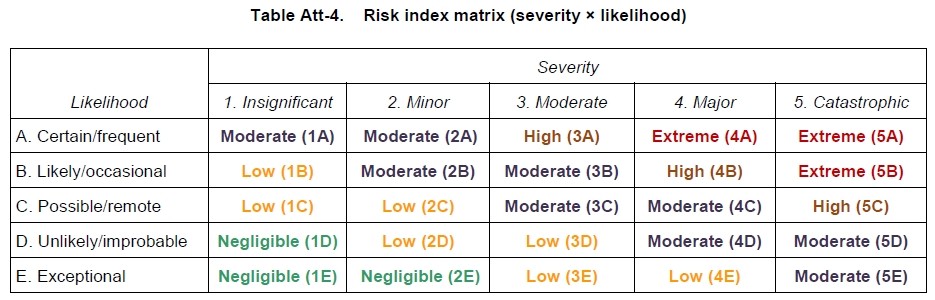
Once more referring to the risk rating matrix above from ICAO Doc 9859, let's assume that we have reviewed a proposed flight to a new destination and decided that it's worthy of a 4C or Moderate rating. Maybe we are talking about operations into a high altitude airport to which we haven't operated in the past. Our rating is on the basis that there are known operational hazards arising from the simple aerodynamic facts that IAS≠TAS and AGL≠AMSL (aircraft is flying faster during takeoff and landing than would be the case at a low altitude airport; and, there is ground in the way if one descends without consideration {and to be clear, that's rarely a good idea}).
So they are the 'known unknowns' that raise our interest and when viewed through the prognostiscope, lead us to determine that the operation to/from our intended airport carries a Moderate risk rating. Now consider, these different operations all to the same airport:
- Once per year freight charter flight — carrying an aircraft full of blankets due to the upcoming cold winter.
- One off charter flight — carrying 150 skiers who happen to know that there's excellent skiing nearby.
- Scheduled passenger service — 180 seats, once per week.
- Scheduled passenger service — 436 seats, eight times per day.
In Part 1 I postulated that the Risk Rating alone is inadequate for executive overview and decision making. I think that it's possible to see from the four bullet points above, that the Whole of Organisation operational risk, varies in each of these cases even if the Moderate rating does not.
Let's not get too buried into the emotionally fraught comparison of the relative worth of blankets, skiers, scheduled passengers and freighter pilots just at present but instead focus on the changing frequency of the scenarios.
In aircraft design and certification, events are considered as Probable if they have an occurrence rate of greater than 1 × 10⁻⁵ (1 occurrence in every 100,000 events). Events are described as Extremely Improbable if they have an occurrence rate lower than 1 × 10⁻⁹ (1 occurrence in every 1,000,000,000 events). In our risk assessment we've determined that the Likelihood (or probability) is Possible/Remote. Using the certification guidance from FAA AC25-19A, Remote has an occurrence rate of between 1 × 10⁻⁵ and 1 × 10⁻⁷. Let's take the middle ground (logarithmically speaking) and assume a rate of 1 × 10⁻⁶, or 1 in a million, literally.
Using that rate information let's now put points 1. & 4. into some temporal perspective. Our once a year operation is likely to encounter trouble every million years. Our eight times per day flight, equates to 2,912 flights per annum. So we are expecting an event to occur every 1,000,000 ÷ 2,912 = 343.4 years. A week is a long time in aviation so 343 years is extrapolation way beyond the bounds. However, it is clear that an event occurring once every million years is less troublesome than one which might occur three times in every millennium.
In a safety sensitive industry such as aviation, executive leadership is interested (or should be) in the Whole of Organisation risk level. That's not measured on a per flight basis but using a time frame. 'How does this year compare to last year?' 'Are we exposed to particular risks this quarter/season due to weather?' It's simply not possible to determine the Whole of Organisation risk level without considering the number of times in any given period that the particular activity occurs.
One comment to my previous post, from Steve Bentley, highlighted that this risk rating doesn't deal with the 'hidden risks'. He is quite correct. The risk Likelihood for this activity is determined by us, using whatever methodology we have in place. By definition we only rate those risks we can foresee, so Black Swan events aren't included. The conclusion that we can draw is that the probability of an event is at least as likely as we forecast.
Extending the concept of frequency into the 3rd dimension of the risk assessment matrix to develop a useful decision support tool/methodology will be the focus of Part 3. In the meantime, disagreement and dissent are welcome. I may open the gates guarded by Cerberus here but I contend that Peer Review, the revered method in academia for all that is good, is much more productive if conducted during the genesis of an argument, rather than post factum.